
The economic and geo-political cross currents combined to increase market volatility this quarter but that isn’t obvious from looking at the returns. The broad US bond market was flat for the quarter, with longer dated Treasury price volatility increasing, particularly toward the end of the quarter. The long end of the Treasury yield curve (20+ years) was up 0.4% for the quarter. Other areas of the fixed income markets such as Preferreds, High Yields and International bonds were +/- 0.5%, in line with the US bond market. The S & P 500 was up 0.6% for the quarter, though the NASDAQ Composite was up a bit more at 1.1%. Size continued to play a major role as small caps underperformed large caps with the Russell 2000 down 4.3% and the Russell 1000 up 0.2% reversing last quarter’s outperformance by small caps. Growth outperformed Value this quarter with cyclically sensitive stocks such as Industrials, (-4%), Basic Materials (-3.5%) and Energy (-2%) reversing their outperformance from earlier in the year as the pace of the economic expansion began to normalize. The early Pandemic favorites such as Technology (+1%) and Healthcare (+1%) rebounded a bit from last quarter’s pause. Precious metals were down (Gold -1%, Silver -15%) but broad Commodities continued to outperform, appreciating another 7.5% during the quarter as the inflation concerns we’ve had has become a major area of focus among investors.
For the nine months ending September, the S & P 500 was up nearly 16% with the NASDAQ up about the same at 15% and the Russell 2000 up 12% as well. The best performing sectors remain Energy (+42%) and Financials (+29%) while Utilities and Consumer Staples underperformed returning 4% thru September 30th. The broad fixed income market was down about 2% for the nine months with zero coupon long dated Treasuries down about 10% for the nine months. International stocks lagged the US with developed markets up about 8% and emerging markets down about 2% on a year-to-date basis. The commodity index continued to lead, returning nearly 34% this year after last year’s underperformance.
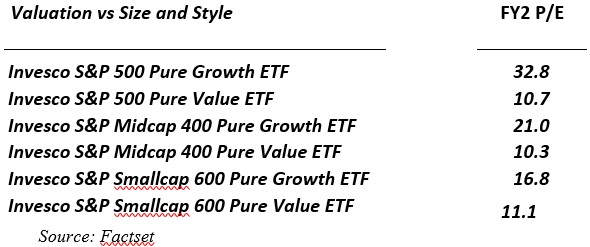
There has been a great deal of digital ink spilled recently about whether or not the US stock market is overvalued. We have always taken the view that it is actually a market of stocks, that is, one needs to look below the surface to determine if there are truly valuations problems lurking. We look at both size (Large Cap, Mid Cap, Small Cap) and style (Growth, Value) when trying to answer the perennial question – how attractive are stocks? As shown in the table below, from a Price/Next Year’s Earnings basis – only large cap growth stocks look particularly overvalued:
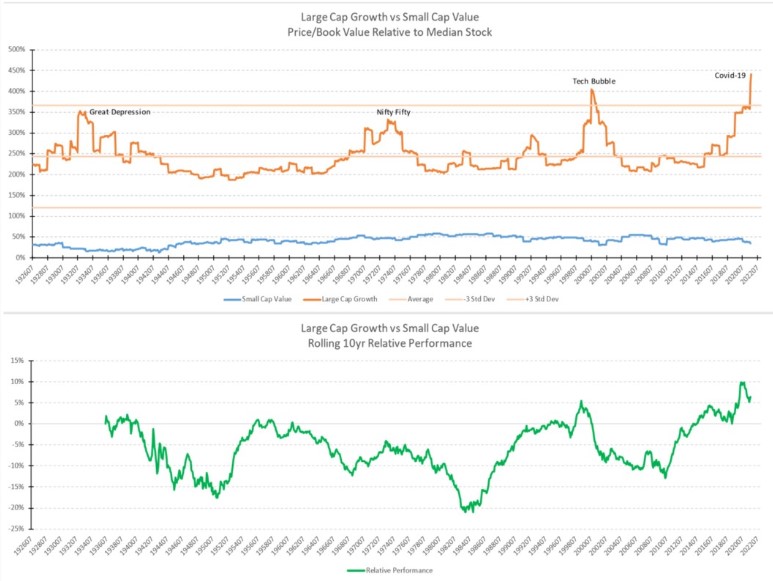
We’ve been concerned since the beginning of this year regarding the vulnerability of large cap growth stocks, particularly as we believe that inflation will continue to accelerate, and with it, bond yields will rise (please see our website for our further thoughts on inflation). Much like zero coupon bonds, high valuation growth stocks are extremely sensitive to rising interest rates and we’ve been investing clients’ portfolios with this in mind. When viewed over the very long term (95 years), large cap growth stocks are the most expensive they’ve been on a relative valuation basis when compared to the median US stock. I’ve updated some research I first did over 20 years ago, which was the last time large cap growth stocks were the most expensive they had ever been. Since investors tend toward extremes, we look at the resulting relative performance of large cap growth stocks compared to small cap value stocks. As you can see from the chart below, there have been four extreme valuation points in the last 95 years: The Great Depression (1933), the Nifty-Fifty (1973), the Tech Bubble (1999) and today. For those of you unfamiliar with the Nifty-Fifty era of the late 1960s – early 1970s, this was when “one decision” stocks ruled, i.e. buy and hold forever. These stocks had extremely high P/E’s especially in comparison to interest rates with the 10-year Treasury yielding 6.5% at the time. Examples would include McDonalds (71x), Polaroid (95x), Digital Equipment (56x), Kodak (44x), Xerox (46x), Disney (71x), and Sears Roebuck (29x) – it is interesting to note that most of these companies no longer exist and I could make an equivalent list of companies from the Tech Bubble.
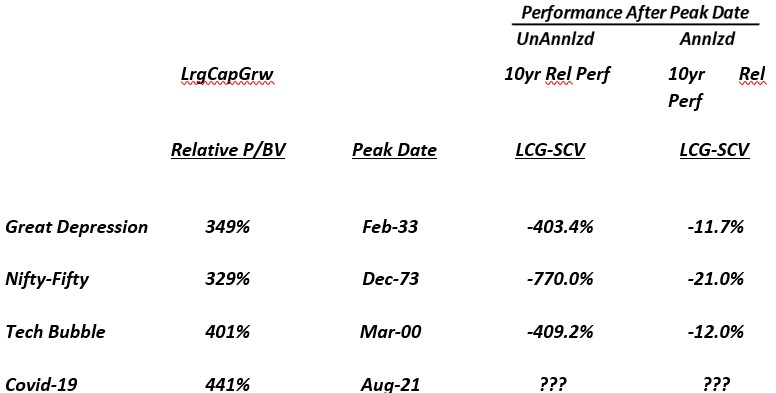
As you can see from the table below, switching out of large cap growth at peaks such as we are seeing now can be very beneficial to the relative performance of your portfolio. We continue to find multiple asset classes, both in the US and around the World, considerably more attractive than the current vintage of “one-decision stocks” such as Nvidia (45x), Tesla (108x), PayPal (45x) or Amazon (50x).
We at Twelve Points Wealth hope you and your family have a happy and healthy upcoming holiday season. Please call or email if you have any questions.
![]()
Steve Bruno, CFA
Chief Investment Officer
October 1, 2021
Disclaimer: Historical data is not a guarantee that any of the events described will occur or that any strategy will be successful.
Past performance is not indicative of future results. Returns and data cited above are from various sources including Factset, Bloomberg, Russell Associates, S&P Dow Jones, MSCI Inc., The St. Louis Federal Reserve and Factset, Inc. The content is developed from sources believed to be providing accurate information.
The information in this material is not intended as tax or legal advice. Please consult legal or tax professionals for specific information regarding your individual situation. The opinions expressed and material provided are for general information and should not be considered a solicitation for the purchase or sale of any security. Investing involves risks, including possible loss of principal. Please consider the investment objectives, risks, charges, and expenses of any security carefully before investing.
Twelve Points Wealth Management, LLC is an investment adviser located in Concord, Massachusetts. Twelve Points Wealth Management, LLC is registered with the Securities and Exchange Commission (SEC). Registration of an investment adviser does not imply any specific level of skill or training and does not constitute an endorsement of the firm by the Commission. Twelve Points Wealth Management, LLC only transacts business in states in which it is properly registered or is excluded or exempted from registration.